
THE NUMBERS EXPLAINED
One great run or a real trend? How to read changes over time
Training happens across weeks. A useful trend keeps individual runs visible and makes its comparison window clear.
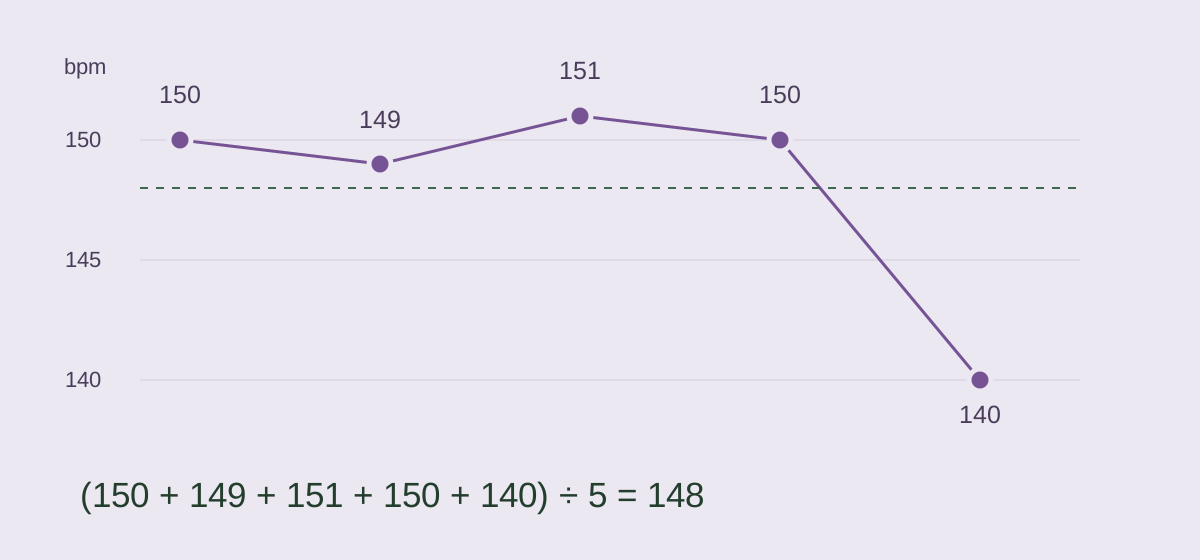
One unusual observation can move an average
Consider five illustrative runs at a comparable pace, with average heart rates of 150, 149, 151, 150 and 140 bpm. Their arithmetic mean is 148 bpm; their median, the middle value after sorting, is 150 bpm. The last run lowers the mean, but four of the five observations remain close to 150.
Investigate before removing a point
The 140 bpm value could reflect a genuinely different effort, different conditions or a recording issue. The five numbers alone cannot tell us which. Check the route, duration, chart coverage and notes. Do not delete a valid run simply because it disagrees with the pattern, and do not present the median as automatically more truthful.
A rolling window changes what counts
A three-run average uses the latest three observations. In this example, the first window averages 150 bpm and the final window averages 147 bpm. A five-run window gives 148 bpm. None is a hidden fitness verdict: each summarizes a different set of runs. Three runs can also span very different numbers of days.
NIST describes averaging as a general smoothing technique and explains why a single overall mean may be unsuitable when the data contain a trend. Smoothing can make a pattern easier to see, while concealing short changes. Keep the original observations alongside the summary.
Build a comparison you can repeat
Use Runome to revisit similar runs and inspect the effort behind each result. Keep the purpose and conditions as comparable as practical, then look for a pattern across several observations. These short windows illustrate public statistical ideas; they do not describe Runome training-load or readiness algorithms.
Explore run comparison in Runome